YouTube Thumbnail Analytics: Metrics That Actually Matter
Go beyond basic click-through rates. Learn which thumbnail performance metrics truly indicate success and how to use analytics to continuously improve your thumbnail strategy.
YouTube Thumbnail Analytics: Metrics That Actually Matter
Many creators obsess over click-through rate without understanding the broader analytics picture. While CTR matters, it tells only part of the story. This guide explores the metrics that genuinely indicate thumbnail success and how to use data to drive continuous improvement.
Beyond Click-Through Rate
Why CTR Is Incomplete
Click-through rate measures initial attraction but ignores what happens after the click:
- A misleading thumbnail might have high CTR but poor retention
- Viewers who click and leave immediately harm your channel
- CTR varies dramatically by traffic source and content type
The Holistic View
Effective thumbnail analysis considers the entire viewer journey:
- Impression to Click: CTR (initial attraction)
- Click to Watch Time: Average view duration (content match)
- Watch to Action: Engagement metrics (satisfaction)
- Repeat Viewing: Return viewers (trust building)
Core Thumbnail Metrics Explained
Click-Through Rate (CTR)
Definition: Percentage of impressions that become clicks Calculation: (Clicks ÷ Impressions) × 100
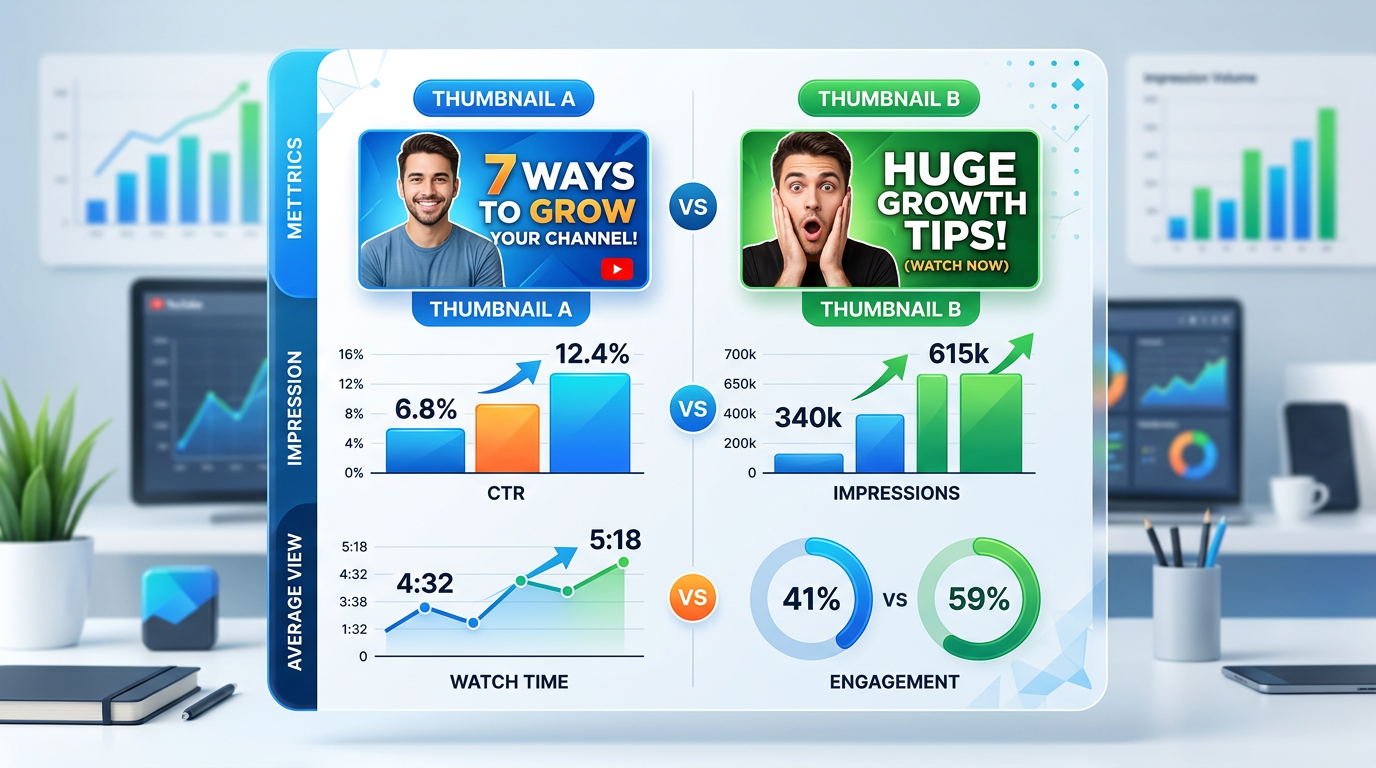
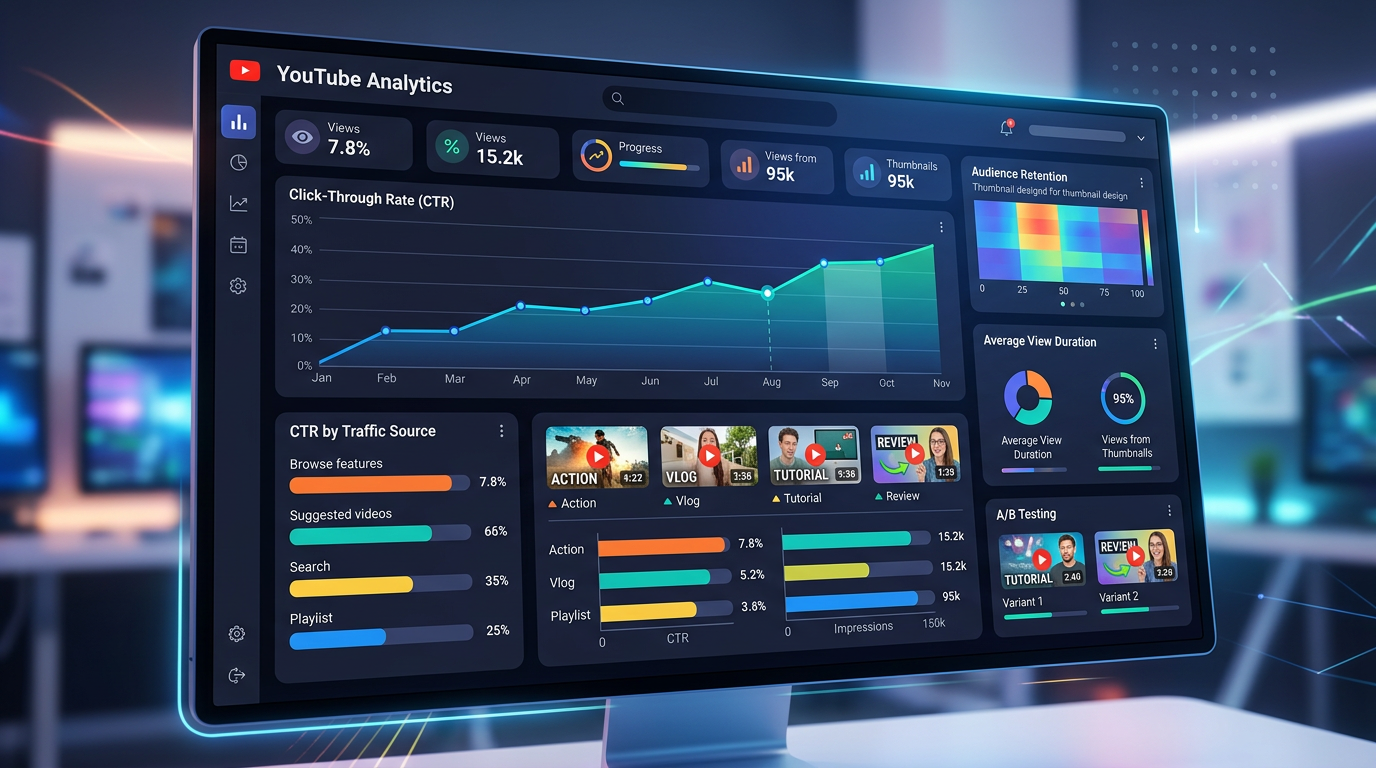
Figure 1: Analytics comparison chart showing thumbnail performance metrics, professional i...
Benchmarks:
- 0-2%: Below average, needs improvement
- 2-5%: Average performance
- 5-10%: Good performance
- 10%+: Excellent performance
Context Matters:
- New channels often see higher CTR (subscriber-heavy impressions)
- Large channels often see lower CTR (broader, less targeted impressions)
- Different content types have different CTR expectations
Impressions Click-Through Rate
Definition: CTR specifically from impression sources Importance: Shows thumbnail performance in discovery contexts
Key Impression Sources:
- YouTube Search: Active intent, often higher CTR
- Suggested Videos: Passive discovery, variable CTR
- Browse Features: Feed browsing, competitive CTR
- Channel Page: Subscriber browsing, often highest CTR
Average View Duration (AVD)
Definition: How long viewers watch after clicking Thumbnail Connection: Indicates content match quality
Interpretation:
- High CTR, Low AVD: Thumbnail over-promises or misleads
- Low CTR, High AVD: Thumbnail under-promises or fails to attract
- Balanced CTR and AVD: Thumbnail accurately represents content
Thumbnail-Specific Retention
What to Analyze:
- First 30 seconds retention rate
- Drop-off points in intro
- Return viewer percentage
Optimal Pattern: Strong thumbnail creates appropriate expectation; content delivers on that expectation, resulting in strong early retention.
Advanced Analytics Approaches
Traffic Source Breakdown
Analyze CTR by traffic source:
YouTube Search CTR:
- Indicates keyword and topic relevance
- Shows how well thumbnail matches search intent
- Compare across different search terms
Suggested Video CTR:
- Shows competitive strength in recommendations
- Indicates visual appeal in browsing context
- Reflects relevance to related content
Browse Features CTR:
- Measures feed performance
- Shows mobile optimization effectiveness
- Reflects real-time competitive positioning
Audience Segment Analysis
Different viewers respond differently:
Subscribers vs. Non-Subscribers:
- Subscribers often have higher CTR (familiarity, trust)
- Non-subscribers indicate growth potential
- Wide gap suggests thumbnail appeals more to existing audience
New vs. Returning Viewers:
- New viewer CTR shows growth appeal
- Returning viewer CTR shows retention strength
- Balance indicates healthy channel growth
Temporal Performance
Track thumbnail performance over time:
Initial Performance:
- First 24-48 hours crucial
- Early CTR affects algorithmic promotion
- Compare initial vs. long-term CTR
Long-Term Decay:
- Most thumbnails decline in CTR over time
- Track decay rate across your content
- Identify evergreen content with sustained CTR
Relative Performance
Compare to your own benchmarks:
Channel Average Comparison:
- Compare each video to your channel average
- Identify outliers for study
- Track improvement over time
Category Comparison:
- Compare to similar creators
- Understand genre-specific benchmarks
- Identify competitive opportunities
YouTube Studio Analytics Deep Dive
Reach Metrics Tab
Key Data Points:
- Impressions over time
- CTR trend
- Traffic source breakdown
- Top impression sources
Analysis Approach:
- Identify which traffic sources drive best CTR
- Note CTR trends across recent videos
- Compare impression volume to CTR relationship
Engagement Metrics Tab
Key Data Points:
- Average view duration
- Audience retention graph
- Likes and comments
Thumbnail Connection:
- Compare retention curves across thumbnails
- Note early-drop patterns (potential thumbnail/content mismatch)
- Correlate engagement with thumbnail styles
Audience Tab
Key Data Points:
- Subscriber status breakdown
- Geography distribution
- Age and gender demographics
Thumbnail Implications:
- Understand who your thumbnail appeals to
- Identify potential audience expansion opportunities
- Tailor design to primary demographic
A/B Testing Analytics
Interpreting Test Results
Statistical Significance:
- Ensure adequate sample size (1,000+ impressions per version)
- Consider confidence intervals
- Avoid premature conclusions
Winner Determination:
- YouTube automatically selects winner based on CTR
- Consider secondary metrics (watch time, engagement)
- Document learnings for future application
Post-Test Analysis
Learnings Extraction:
- What specific element caused the difference?
- Does the winning element work across content types?
- Can the insight be applied to other videos?
Application Strategy:
- Implement winning approaches in future thumbnails
- Continue testing variations of successful elements
- Build a knowledge base of what works for your audience
Creating an Analytics Dashboard
Key Metrics to Track
- CTR by Video - Identify top performers
- CTR Trend - Track improvement over time
- CTR by Traffic Source - Understand context
- AVD vs. CTR - Balance attraction and delivery
- Subscriber vs. Non-Subscriber CTR - Growth vs. retention
- Thumbnail Style Performance - What designs work
Spreadsheet Tracking
Create a master thumbnail database:
- Video title and publish date
- Thumbnail description/style
- Initial CTR (first 48 hours)
- Current CTR
- Impressions count
- Average view duration
- Traffic source breakdown
- A/B test results (if applicable)
- Notes on design elements
Pattern Recognition
Look for correlations:
- Color choices and CTR
- Text length and CTR
- Expression type and CTR
- Layout structure and CTR
- Time of publication and initial CTR
Common Analytics Misinterpretations
The High CTR Trap
Mistake: Celebrating high CTR without context Reality: High CTR with low watch time indicates misleading thumbnails
The Low CTR Panic
Mistake: Abandoning effective strategies after one low CTR video Reality: Single videos may underperform for reasons beyond thumbnail
The Average Obsession
Mistake: Focusing only on beating channel average Reality: Category benchmarks provide better context
Ignoring Sample Size
Mistake: Making decisions based on small impression counts Reality: 50 impressions don't provide statistically significant data
Actionable Analytics Framework
Weekly Review Process
- Identify Top Performers: Videos with best CTR and watch time
- Analyze Success Factors: What thumbnail elements do they share?
- Identify Underperformers: Videos with low CTR
- Diagnose Issues: What might be causing poor performance?
- Apply Learnings: Adjust upcoming thumbnail strategy
Monthly Trend Analysis
- Calculate Monthly Averages: CTR, impressions, watch time
- Compare to Previous Months: Identify trends
- Correlate with Changes: What changed in your approach?
- Set Goals: Define improvement targets
Quarterly Strategy Review
- Assess Overall Progress: Are metrics improving?
- Identify Best Practices: What have you learned?
- Document Guidelines: Update your thumbnail style guide
- Plan Tests: Define what to test next quarter
Building Data-Driven Intuition
The Learning Loop
- Create: Publish thumbnail
- Measure: Track performance metrics
- Analyze: Understand what worked or didn't
- Learn: Extract principles and patterns
- Apply: Implement in next creation
Developing Pattern Recognition
Over time, you'll develop intuition for:
- What CTR to expect for different content types
- Which thumbnail elements drive performance
- How your audience responds to various approaches
Balancing Data and Creativity
Data Informs: What has worked historically Creativity Explores: What might work in new ways
Use analytics to understand your baseline, then push boundaries creatively while measuring results.
Conclusion: Analytics as Feedback Loop
Thumbnail analytics provide the feedback necessary for continuous improvement. The creators who thrive are those who systematically measure, learn, and iterate based on data.
Remember that metrics represent real viewers making real decisions. Each data point tells you something about what your audience values and how well you're communicating your content's value.
Build analytics review into your regular workflow. Let data inform your decisions while maintaining creative experimentation. Over time, this systematic approach transforms thumbnail creation from guesswork into a reliable, repeatable process that consistently drives clicks and builds audience.
The numbers don't lie—but they do require interpretation. Develop your analytics literacy, trust your accumulating data, and let evidence guide your evolution as a thumbnail creator.
jackyi
YouTube content strategist and thumbnail optimization expert. Passionate about helping creators grow their channels through data-driven design and SEO best practices.